Skip to content
Performance attribution - BrinsonFachler2
Kristoffer Fürst6 min read

Performance Attribution Software [+ reporting & data management]

Performance attribution is a complex area. Most of the complexity lies in ensuring data needed is accurate and complete.

Transaction-based performance calculations are the next obstacle to overcome. Once there however, the actual performance numbers are surprisingly simple to calculate.

This article looks at the different solutions to getting the data requirements right. We then go into ways to calculate performance and approaches to migrating to a new system.

Performance attribution - BrinsonFachler2

The performance calculation process

In this section, we cover transaction-based vs position-based, TWR calculation, benchmark returns and data and finally the performance calculation (e.g. Brinson-Fachler). You can skip it if you are already intimately familiar with the calculation and pre-processing process.

Step 1: Returns for your portfolios

Step 1A: Transaction-based vs position-based

Transaction-based is the only attribution that is accurate. It accounts for any transactions (orders) that happen – when they happen.

Position-based attribution, on the other hand, uses a portfolio snapshot at the beginning of a period. That period can be daily, weekly, monthly, etc. It doesn’t account for any changes to the portfolio during the period, so it won’t be entirely accurate even if the period is as short as daily.

Step 1B: Time-weighted returns time series

Now, you have a rate of return (ROR) time series for each holding and day. This is a P&L number, expressed as a % of the start-of-day exposure.

If ROR is calculated daily from start-of-day data, it can be used as-is. 

However, if it's based on end-of-data data or spans longer periods than daily, it must be adjusted for subscriptions and redemptions. Since the benchmark we’re about to compare against doesn’t have inflows/outflows, we need to adjust our ROR before we can start the comparison. This adjustment gives us what is called time-weighted returns (TWR).

Step 2: Benchmark returns

Benchmark data is often an index, either standard, custom, or blended. We also see ETFs be used as indices to avoid the licensing costs associated with indices.

Sources for benchmark data can be:

  1. Files (e.g. CSV files received from the index provider directly or a market data vendor). With Limina, you can automate file import via a user-configurable import/export engine.
  2. Automatic integration to a index data management solution, such as Bloomberg Data License or Rimes Technologies

Step 3: The actual performance attribution calculation

Now that we have the data prepared, we can calculate the actual performance.

Brinson-Fachler Attribution

The most commonly used performance attribution model compares the return of a portfolio to its benchmark. It breaks the difference down into three components:

  1. Allocation effect
    What difference in performance is due to higher or lower allocation to a specific segment (e.g. industry sectors)?
    Note: the same calculation could be applied to asset class allocation for a mixed equity/bond portfolio with a blended benchmark. It’s then a deviation from the standard Brinson-Fachler model.
  2. Selection effect
    Answers the question: “How much of the under/over performance is due to which assets we decided to invest in – within each segment?” 
    For example, if we had a higher exposure to Apple in the technology sector than the benchmark, what effect did that have on our return relative to the benchmark?
  3. Interaction effect
    Suppose you’ve picked great stocks in a sector, so your selection effect is positive. But you’ve also underweighted that sector significantly, and the sector performed well, so you have a negative allocation effect. The total performance will therefore have a third component: how these two decisions affected each other. A low interaction effect can be interpreted as the manager is making isolated, clear bets on how to beat the benchmark.
  4. FX effect
    The impact from FX can optionally be split out as a separate effect or be part of the other effects.

The Brinson-Fachler model sometimes comes in a "2 factor"-flavor, in which case the interaction effect is merged into the allocation or selection effect - instead of reported separately.

Fixed income attribution software

For fixed-income, sector and allocation breakdown isn’t as useful as it is for equities – although it can be used. Potentially most informative is for a fixed income performance attribution system to look at aspects such as:

  • The performance effect from the passage of time
  • Yield from risk-free interest
  • Yield from credit risk

It’s possible to dig much deeper, breaking apart the effect of yield curves shifting vs. changing shape (twisting).

Show more

Investment performance reporting

Once you have the performance numbers, you need ways to report them. Display of data within the application is available in all performance systems we know. Many enable you to export the data to CSV/Excel files.

Limina takes reporting one step further, by having reporting software as an integrated component of the product suite. With the investment performance reporting software, you can create your own reports, integrate with BI platforms and there’s even a native Excel plug-in.

Excel pluginStandalone system vs integrated

The accounting book of record usually isn’t adequate to be the basis for performance calculations. Treatment of accrued income and dividends, is posted to accrual accounts and not included in the P&L calculation of the holding. Which doesn’t work for performance calculations.

If you have a 2nd or 3rd generation investment book of record such as Limina, that data source is already prepared for calculating performance. All transactions and cash movements are already in the system, data quality has been checked, and P&L is calculated on a position basis.

Since Limina is a portfolio management system, it’s also used for portfolio rebalancing. For this application, benchmarks are used – either to rebalance against or to see how exposures compare to benchmarks when rebalancing. In other words, the benchmark data is already in the system!

With all the data already available and quality controlled, attribution is just a matter of calculations. No additional work is required by your team - no integrations, etc. Performance attribution reports are produced at the click of a button. Book a no-strings-attached demo of Limina to see it for yourself.

Migrating from existing portfolio attribution software

If you have a performance attribution tool in place and are considering changing to another one, you will probably want to bring historical data. There are two ways to do this:

Approach Pros Cons
Move all underlying data (steps 1-2 above) and rerun calculations in the new attribution software Gives you the flexibility to change attribution model historically Very time-consuming to replicate historical TWR calculations
Move only the calculated performance numbers Fast to implement and low risk (using already validated numbers) Might not be well-supported by all systems (Note: this is supported in Limina)


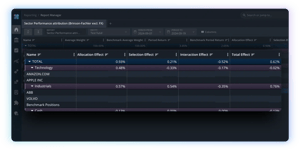
Limina’s Performance Attribution System

Limina’s investment performance software is part of our investment management software suite. Data quality controls are centralised and a book of record engine can produce portfolio views for any use case – including performance. All modules leverage the data controls that are performed once, so you don’t have to maintain data in various places.

The calculations are transaction-based daily TWR (the most accurate approach) and history can easily be migrated. Finally, calculations are inspectable, so you have full transparency into how a number has been derived with the click of a button.

Explore a better performance attribution software

Efficient data quality controls and embedded reporting.

avatar

Kristoffer Fürst

Front Office quant experienced across listed and OTC asset classes and global investment strategies.

RELATED ARTICLES