Why investment managers select Limina
Top 4 use cases
We list the most common reasons why investment managers procure Limina's modern platform.
98% of investment manager have unnecessary manual processes
According to quantitative research performed by Limina. This is typically caused by:
Save up to 4 hours / person / day
With carefully designed solutions across the investment management workflows, we help clients significantly improve their operational efficiency.
The productivity gains PER PERSON EACH DAY can be as much as:
70% of investment managers are concerned about system costs
Limina can help you reduce costs through increased operational efficiency, self-service applications (integrations, compliance, etc) and a cloud-native environment. We've seen saving of as much as:
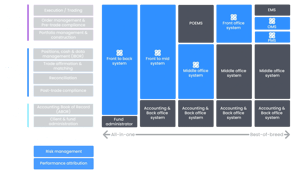
Move to/from any operating model
Regardless of your operating model, Limina’s flexible solution will support you both today and in the future; should you decide to make changes. For example, we have helped clients:
- Outsource (trading, data management, middle/back office)
- Adopt a centralised or distributed operating model

Common Front Office data challenges
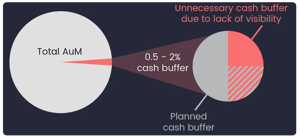
The cost of cash buffer
Limina’s surveys of asset managers show that Investment Managers keep a 0.5-2% cash buffer. The range is generally consistent across AuM levels and asset classes.
And the striking fact is: It depends mainly on the systems used.

How to achieve trusted portfolio data
Current risks faced by investment managers
Before a modernisation project, when using legacy technology or in-house/Excel applications, we observe in our quantitative research:Modernise your system landscape
Three ways we've helped investment managers strengthen governance and achieve a modern operating model:- 4-eye principles
- Full compliance rule support
- Enterprise upgrade management & support
- Process automation
- Data quality controls
- Full integration with your providers

See how Limina can help
Want to see how Limina can help your team achieve operational efficiency, reduce cost, get to your target operating model or any of the other use cases discussed here?


