Performance measurement & attribution
View, analyze and report your portfolio returns compared to benchmark.
An easy way to explain your investment returns
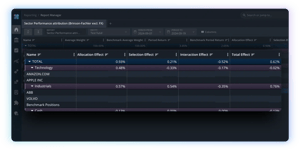
Our flexible performance attribution helps you easily analyze and explain the drivers of excess return vs. benchmark.
Using market standard attribution models (Brinson-Fachler - incl./excl. FX), you can analyze returns on sector, geography or any other custom segment - across any time period.

The Brinson-Fachler method is a popular attribution model that seeks to explain the portfolio performance vs benchmark (also known as active return). It does so using the following key factors:
- Allocation effect: The effect of over- or under-allocating a given segment (e.g. a specific sector)
- Selection effect: The effect of actual security selection within the given segment
The model also includes a third Interaction factor which is less intuitive, but a mathematical necessity for the figures to add up: Total effect = Allocation + Selection + Interaction.
The model can also be tweaked to include a separate FX component, to attribute foreign exchange movements separately from the above.
Accurate & transparent
No approximations - our performance attribution is based on your actual daily data:
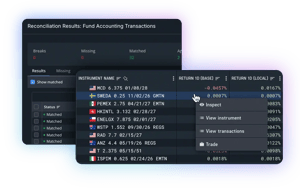
- Transaction-based (using the reconciled transaction data in Limina)
- Includes all fees and expenses that contribute to the NAV
- Returns calculated as daily time-weighted returns (TWR), ensuring accurate representation of inflows/outflows
- No black box - inspect figures to see how they are calculated


No integration pains.
Integrating external performance attribution software can be challenging, due to the scope and complexity of the data involved.
Not with Limina, since our performance attribution functionality leverages the quality-controlled data in Limina directly.

CURIOUS TO LEARN MORE?
Don't hesitate to get in touch - we're happy to advise on any questions you may have about the product and how it can fit into your landscape and support your target operating model.


